How to read your blood glucose results and how to interpret glucose levels using simple and easy sugar chart for all ages and conditions, below is blood glucose level map in mmol/l unit (used in UK) and determined values in mg/dl unit (used in USA, Canada, and world wide). you're here because you want to understand what should your blood sugar level be?
I've sent many questions out there such as:
- What is normal blood sugar level for adults man or woman?
- Are kids sugar levels chart different than old person sugar?
- What is the standard glucose value to adjust my sugar level?
- Have my glucose treatment succeeded?
- Do I still in danger of high glucose values?
- What are blood glucose levels for non-fasting males and females?
- What is the blood sugar range for a non diabetic person?
- Are morning blood sugar levels diabetes or non diabetic?
- What is the safe sugar level during pregnancy?
- Do glucose in blood after eating rise or be normal?
- How bad is my blood glucose level?
And other questions like that, just follow my guideline to understand the glucose levels and what do they mean?
Estimate your blood sugar level in the lab
After receiving your lab work results, just look to your lab report and save in your mind the numbers typed right in front of test name called one of these:
Blood Glucose (not common and usually preceded by type of sample as following below)
Serum Glucose ("serum or blood" in medical reports for glucose test may be used as synonymous, also S. before the test name means "serum" and Bl. for "blood")
Random blood glucose (Levels of sugar in the blood of a person at ant time of the day except fasting)
Fasting Blood Glucose (sugar level in patient's blood after fasting from 6 -8 hours or overnight fasting)
2h Postprandial Glucose (estimating how sugar reaches its level in blood two hours after eating a usual meal)
Identifying a glucose range in sugar levels table
Print the glucose levels table below or fix screen to make it in front of your eyes. Do not look around, just keep your focus on the figures in the report and compare it to the level ranges sorted in the sugar chart.
Describe you diabetic condition
Once you find a corresponding glucose range to your level in the glucose test results, then by now you've found what your sugar levels are whether you have a normal sugar or abnormal levels or whatever it be, it going to describe your diabetic status, I mean are you diabetic or non-diabetic, if you discover diabetic then learn how to control diabetes level to reach the normal blood sugar figures, if you got the non-diabetic status then everything is great.
Know the exact steps to do in each situation to be reassured. Set control blood sugar levels during Diabetes, pregnancy, childhood, and for every type of diabetes mellitus.
Blood Sugar levels chart for Type1,2 Diabetes (in mg/dl and mmol/L) Vs urine glucose amounts
Download complete blood glucose scale Diagram in PDF, xls Excel format, PPT, or Image
Also, there a separate chart for urine glucose levels
- 1000 mg/dl Blood glucose value (55.56 mmol/L) seen (+++++) in urine glucose test, a rare but possible condition, ridiculously high sugar in alive person, long period in that level lead to death.
- 700 mg/dl Blood glucose value (38.39 mmol/L) seen (++++) in urine glucose test, a higher but possible diabetes condition, unless the patient admitted it will be among the dead.
- 600 mg/dl Blood glucose value 600 mg/dl (33.3 mmol/L) seen (++++) in urine glucose test, high mortality rates and passing out for a long time (coma).
- 500 mg/dlBlood glucose value (27.78 mmol/L) seen (++++) in urine glucose test, a critical value with serious complications which requires fast medical decision.
- 400 mg/dl Blood glucose value 400 mg/dl (22.22 mmol/L) seen (++++) in urine glucose test, a dangerous blood sugar levels chart starts in counting, immediate sugar control is must, HBA1C test is required to decide the treatment type and plan.
- 300 mg/dl Blood glucose value (16.67 mmol/L) seen (+++) in urine glucose test, an uncontrolled diabetes mellitus, Hemoglobin A1C test is required to start medication course but it isn't a dangerous level and doesn't require hospitalization.
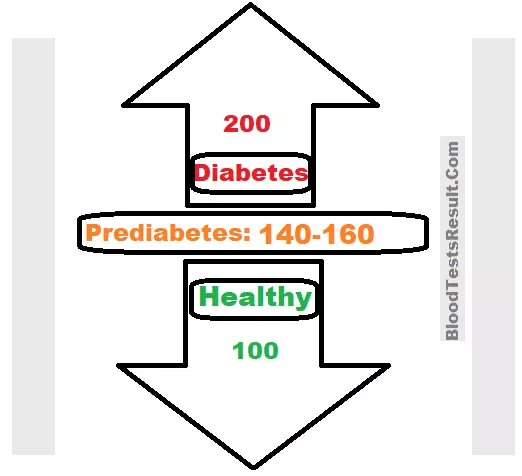
- 200 mg/dl Blood glucose value (11.1 mmol/L) seen (++) in urine glucose test, a diagnostic glucose level which means when your glucose reading is 200 after a meal you certainly a diabetic person, with random blood sugar 200 mg/dl is called "Diabetes"
- 180 mg/dl Blood glucose value (10 mmol/L) seen (+/++) in urine glucose test, high glucose value for RBG test and considered a control level for children type 1 DM.
- 162 mg/dl in blood glucose test (9 mmol/L), what seen in urine test is (trace/nill), a target Postprandial sugar level for type 1.
- 153 mg/dl in blood glucose test (8.5 mmol/L), what seen in urine test is (trace/nill), a target 2hpp sugar Level for Type 2 diabetes mellitus.
- 150 mg/dl in blood glucose test (8.3 mmol/L), what seen in urine test is (nill), a borderline or normal glucose results for Random non fasting sugar measurement.
- 144 mg/dl in blood glucose test (8.0 mmol/L), what seen in urine test is (nill), a fasting children type1 upper sugar level
- 140 mg/dl in blood glucose test (7.78 mmol/L), what seen in urine test is (nill), upper limit of normal random and post-prandial blood glucose results
- 126 mg/dl in blood glucose test (7.0 mmol/L), what seen in urine test is (nill), the diagnostic fasting blood sugar is 126 mg/dl and higher, it's considered the entry glucose value to diabetes
- 125 mg/dl in blood glucose test (6.94 mmol/L), what seen in urine test is (nill), Upper Normal glucose limit allowed for fasting.
- 110 mg/dl in blood glucose test (6.11 mmol/L), what reported in urine test is (nill), At fasting suggests Prediabetic and impairment of glucose or DM person need more control.
- 108 mg/dl or 6.00 mmol/L, don't leaking sugar into urine and reported "nill" in the urinalysis report, if seen after 6 - 8 hours fasting sugar test it is considered prediabetic suggestive
- 107 mg/dL or 5.94 mmol/L, nill in urine, an acceptable reading of glucose, a person is non-diabetic still in normal range of sugar in blood
- 100 mg/dL 5.56 mmol/L, urine glucose is absent or nill, excellent normal sugar level for healthy people or a person have tightly controlled his sugar level.
- 72 mg/dl 4.00 mmol/L, nill in urine glucose test, the lowest acceptable sugar level for random and fasting test, your doctor would target this level for successful diabetes control plan.
- 70 mg/dL, 3.89 mmol/L, urine glucose is absent, a fair Hypoglycemia starts which means abnormal low sugar in blood.
- 50 mg/dl, 2.78mmol/L, glucosuria is not found, a finding usually means Hypoglycemic person which common sign is a higher heart rate than usual, also coma is possible.
- 30 mg/dl, 1.67 mmol/L, urinary glucose is not found or nill, a critical low sugar level and very dangerous drop level at which coma can occur, fast hospitalization is must
- 10 mg/dl, 0.56 mmol/L, glucosuria is nill or absent, Clinically alive person sugar must not declined to that level, admission and CCU is urgent.
Some Diabetes testing definitions
RBG is for Random Blood Glucose test, taken anytime between meals, included in non fasting blood sugar levels chart, also called routine sugar measurement however RBG test is a component of routine medical check up panel.
FBG is for Fasting Blood Glucose test, optimal 6 - 8 hrs after last meal or measured morning right out of bed, Read more about fasting blood sugar levels
2hPPG is for 2 Hrs Postprandial Glucose test
Normal Glucose Level means sugar measurement in the blood is within healthy standard values. Target sugar level means the required sugar levels to say that diabetic control succeeded. Critical glucose level value is the most dangerous blood sugar level which harms many other body organs and requires fast clinical hospitalization.
Hyperglycemia means high blood glucose results.
Hypoglycemia means low blood glucose results.
Type 1 Diabetes mellitus is a medical condition due to insulin insufficiency. Type 2 Diabetes mellitus is a medical condition where body cells do not receive glucose due to reasons not related to insulin hormone production. Adults have either type 1 diabetes or type 2 diabetes, while Children usually have type 1 diabetes.
Glucosuria or Glycosuria is a condition when blood glucose amount overflow into urine, seen after blood level exceeds160 – 180 mg/dl, and affected by renal glucose threshold. Glucagon is the name for the hormone that maintain blood glucose levels along with insulin hormone.
Ketonuria is a condition when Ketone molecules appear in urinalysis due to diabetes or starvation or long hospitalization.
Target sugar levels table interpretation
Target level is the normal blood sugar levels a patient must adjust his/her glucose level to it.
Normal level means the glucose levels which restored naturally by the body regulation.
Note that after meal there is what called insulin shot which cause glucose to rise temporarily to 140 mg/dl or 7.8 mmol/L
Target normal glucose ranges map by Diabetes type in mg/dl
- Normal Healthy Ranges: Random 72 - 150, Fasting 72 - 100, after-meal (2hpp) 72 - 140
- For Type1 DM: Random measurement is less preferred as the fasting measurements, Fasting 72 - 126, after-meal (2hpp) below 162
- Type 2 DM: FBG 72 - 126, after-meal (2hpp) under 153
- Gestational diabetes: GTT test is Preferred, fasting 72 - 126, after-meal (2hpp) below 140
- Children type 1 DM: FBG is more diagnostic, fasting level 72 - 144, 2hpp under 180
Sugar levels table for common diagnostic ranges
- 500 - 1500 values are very serious sugar levels, longer period than some minutes without fast hospital admission means death.
- 108 - 126 values are considered prediabetic level which suggests glucose impairment glycemia
- 72 - 125 values, a target blood sugar level for type 1, 2, if seen by fasting sugar test
- 72 - 144 readings, a target level for type 1 DM for children for fasting test
- 30 - 70 values are severe Hypoglycemia
After we've shown expected high blood sugar levels chart, lets know the low sugar levels
Hypoglycemia chart
Hypoglycemia is the case commonly affect alcoholic persons and patients take insulin overdose, also high body demand or low energy source cause body to be hypoglycemic.
Hypoglycemia means that blood sugar level falls below 72 mg/dl or 4.0 mmol/L when sugar test is done.
Low blood sugar chart is simple compared to high sugar level chart
Serious low sugar level is under 50 mg/dl (2.8 mmol/L). Critical sugar hypoglycemia level is 30 mg/dl and lower which it may be the death degree sugar level which need urgent medical decision.
Hypoglycemic person common signs are Sweating, Fatigue, Feeling dizzy, Feeling hungry, A higher heart rate than usual, confusion, and in extreme cases can develop coma and/or other complication as: Cognitive decline; Impact on brain power; Dead in bed syndrome; or Weight gain.
Chart interpretation:
Target Glucose Levels for Type 2 diabetes mellitus
- Fasting glucose level should lies among 72 – 126 mg/dl (equivalent to 4 to 7 mmol/L)
- 2 hours after meal blood sugar level should be under 153 mg/dl (corresponding to 8.5 mmol/L)
Target Glucose Levels for Type 1 diabetes mellitus
- Fasting sugar levels 72 – 126 mg/dl (4 – 7 mol/L)
- Postprandial sugar level should be any figure less than 162 mg/dl (9.0 mmol/L)
Target Glucose Level for Children type 1 DM
- Children diabetic level is a bit higher than adults by 1 mmol/L
- Normal desirable blood glucose level is from 72 to 144 mg/dl (or 4 – 8 mmol/L) for fasting sugar test, i.e. pre-prandial.
- 180 mg/dl (10 mmol/L) is the normal sugar level must not exceed for 2hPP Glucose test.
Gestational diabetes:
A condition occurred to pregnant women due to many reasons some of them related to placental enzymes and others related to kidney problems, for pregnant female diabetes condition called transient diabetes insipidus or fake diabetes and controlled during pregnancy course to not harm fetus or transform to diabetes 2 after years of birth.
Dangerous blood sugar levels chart interpretation
750 is the upper critical high glucose degree (critical hyperglycemic value) for adults and children males and females which can appear in random glucose results. However, American Diabetes Associations reported a blood glucose level 3000 in diabetic patient test results and the patient was on insulin, however he is still alive and not admitted the ICU yet.
10 is the lower critical hypoglycemic value seen in both fasting and non-fasting glucose test results for all ages.
Prolonged glucose values greater that 200 are very serious and cause damage to kidney and body tissues
Resources:
- National Institute for Clinical Excellence (NICE)
- International Diabetes Federation's
- American Diabetic Association recommends
- depts.washington.edu
However your doctor must target your ideal blood glucose level according to your lab results.
Do you have a question about blood glucose levels?
Mention you glucose number in the commenting for below, and get your results explained within 24hrs.
For more: Follow page on Fb page and group, or subscribe by email
